
Generating test data with Fill Function in worksheets
10 minutes · No prior MathJet experience required.
When you need test data quickly — a column of normally-distributed measurements, a series of Poisson-distributed event counts, or a set of uniform-random values — MathJet’s Fill Function dialog lets you generate it directly in the worksheet. One drag, one dialog, one click, and the column is populated. No script, no =RAND() formula, no external CSV to import.
This short tutorial walks through generating three columns of weather-like data: sequential dates via auto-fill, normally-distributed temperatures via the Fill Function dialog, and uniformly-distributed humidity values via the default fill behavior.
Before you start
Section titled “Before you start”- MathJet installed. Download if you haven’t.
- No prior experience required. If you’ve ever used a fill handle in Excel, you’re ready.
Step 1: Start with a blank worksheet
Section titled “Step 1: Start with a blank worksheet”Launch MathJet. An empty workspace appears. Insert a blank worksheet: File → New → Worksheet (or its toolbar button, or click the New tab on the tab bar).
Step 2: Build a date series with auto-fill (column A)
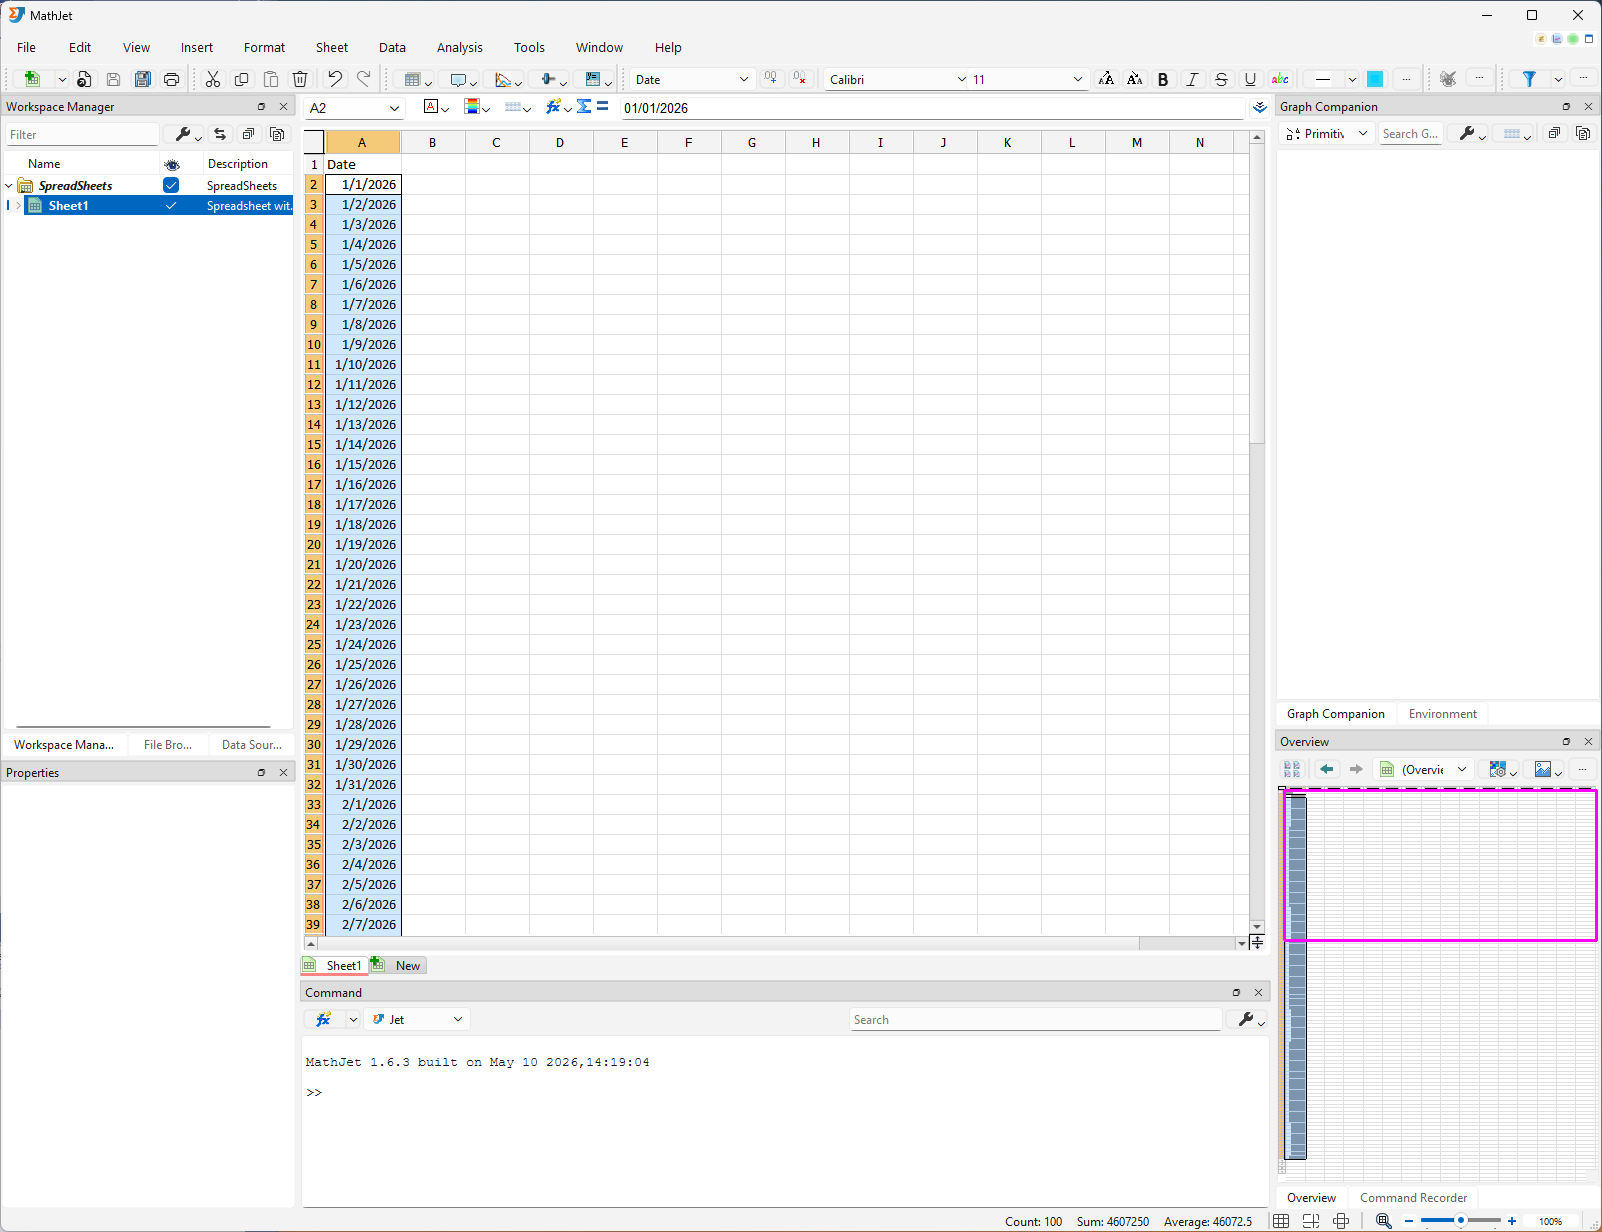
Section titled “Step 2: Build a date series with auto-fill (column A)”Click cell A1, type Date, and press Enter. The cursor moves to A2.
Type 01/01/2026 and press Enter. MathJet recognizes the value as a date.
Click A2 to re-select it. A small square — the fill handle — appears at the bottom-right corner of the cell. Hover over it (the cursor changes to a small crosshair), then click and drag straight down to A101.
A 100-row drag extends well below the visible cells, so you’ll run out of screen room quickly. That’s fine — the worksheet auto-scrolls as you drag past its bottom edge. Just keep moving the mouse downward (or even past the worksheet’s bottom edge), and the sheet scrolls to follow.
As you drag, MathJet fills in sequential dates: 01/02/2026, 01/03/2026, 01/04/2026, and so on. Release the mouse when you reach A101. The last date filled is 04/10/2026 — the 100th day from January 1.
A1 holds the header Date. A2 through A101 hold one hundred sequential dates beginning January 1, 2026.
If the dates appear truncated as ######## — the column-A header is wider than the default cell can show — double-click the boundary line between the A and B column headers. Column A widens to fit the longest entry (the same trick works on any column you ever need to auto-fit).
Step 3: Fill column B with normally-distributed temperatures
Section titled “Step 3: Fill column B with normally-distributed temperatures”This is the MathJet differentiator this tutorial demonstrates.
Click B1, type Temperature, and press Enter.
Click B2 — leave it empty. The fill handle still appears at the bottom-right of B2. Click and drag the fill handle straight down to B101.
When you release, B2:B101 are filled with random numbers — uniformly distributed by default, between 0 and 1. That’s not yet what you want.
Notice the small Fill Option button that appeared next to B101 after the drag. Click it. A menu opens. Choose Fill Function…
A dialog opens. Set:
- Function type: Normal distribution
- Mean:
70 - Standard deviation:
10
Click OK. B2:B101 updates instantly. The cells now hold one hundred random draws from a normal distribution with mean 70 and standard deviation 10 — values clustered around 70 and rarely below 50 or above 90.
Excel’s fill handle does sequential numbers and date series; recent versions added a few smart-fill heuristics. It does not have a Fill Function entry point that lets you populate a range from any of the standard statistical distributions — normal, uniform, exponential, Poisson, etc. — in a single dialog. MathJet treats fill as an entry point into the same statistical machinery the formula bar exposes; in Tutorial 2 you’ll see that machinery is the embedded NumPy/SciPy runtime.
Step 4: Fill column C with uniformly-distributed humidities
Section titled “Step 4: Fill column C with uniformly-distributed humidities”Add a third column. Click C1, type Humidity, and press Enter.
Click C2 — leave it empty. Click and drag the fill handle straight down to C101.
When you release, C2:C101 are filled with random numbers — uniformly distributed between 0 and 1, MathJet’s default for an empty-source fill. You don’t need the Fill Function dialog this time; the default is exactly the distribution you want.
Format column C as a percentage. Humidity is conventionally displayed as a percentage rather than a 0–1 decimal. Click the column-C header to select the whole column (or select C2:C101 directly), then click the % button on the toolbar. The cells’ display format changes — values display with two decimal places followed by %: a value of 0.5274 now reads 52.74%. The underlying values are still 0–1 floats; only the display changes.
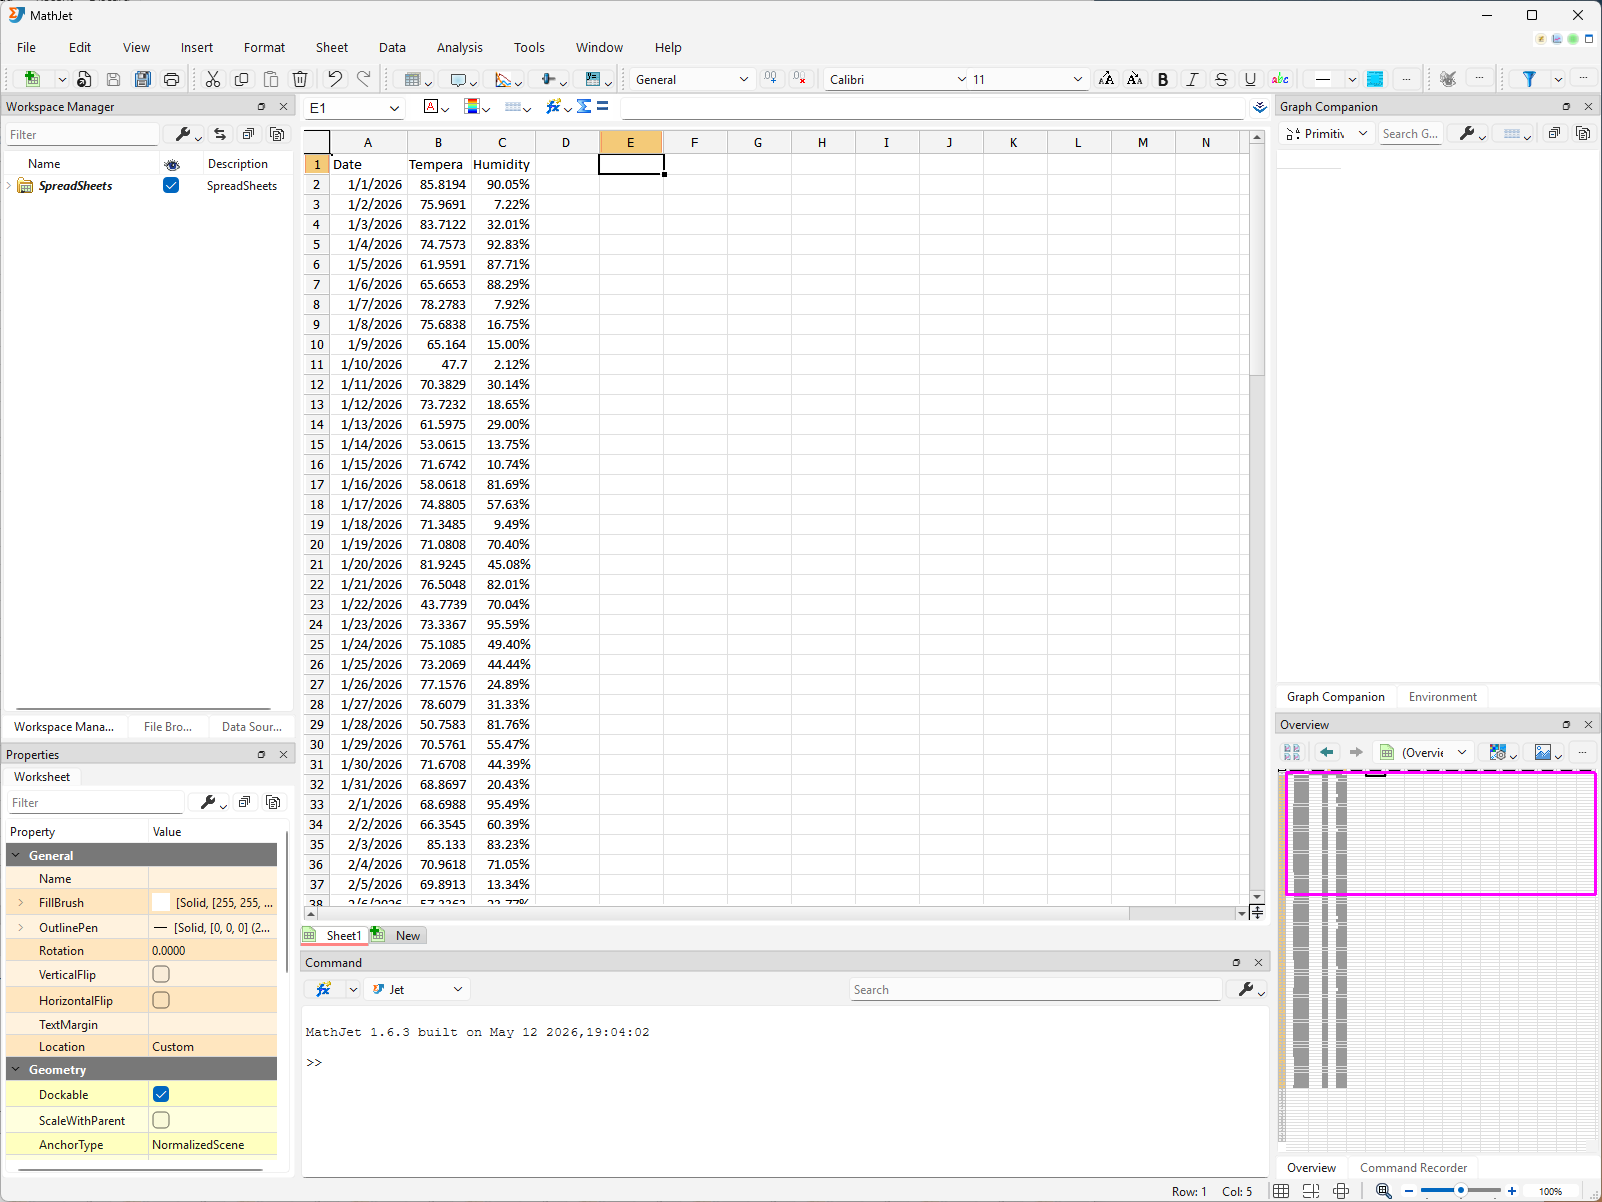
You now have three data columns: 100 dates in A, 100 normally-distributed temperatures in B, and 100 uniformly-distributed humidity values in C (displayed as percentages). Two of MathJet’s auto-fill behaviors, demonstrated in two columns — the Fill Function dialog for choosing a specific distribution, and the default uniform random for casual fills.
What you’ve learned
Section titled “What you’ve learned”- How to use the fill handle to generate sequential data (dates, numbers) by dragging from a starting value.
- How to access the Fill Function dialog from the Fill Option button that appears after a fill-handle drag.
- That the Fill Function dialog supports standard statistical distributions — normal, uniform, exponential, Poisson, and more — and populates the selected range with random draws in a single step.
- That the default fill on an empty source cell produces uniform-random numbers on [0, 1] — useful for casual test data.
- How to format a column as a percentage without changing the underlying values.
Next steps
Section titled “Next steps”The data you just generated is exactly the kind of dataset Tutorial 1: Your first analysis in MathJet works with — chart creation, live linking, data nudging, and the Workspace Manager. If you haven’t done that tutorial yet, it’s the natural next step.
Troubleshooting
Section titled “Troubleshooting”Dragging from an empty cell doesn’t fill it with random numbers. Default fill behavior on an empty cell is “fill with uniform random numbers on [0, 1],” but the setting can be turned off in MathJet’s preferences. The same outcome is reachable directly: select the empty range first, then choose Edit → Fill → Function… from the menu. The Fill Function dialog opens, skipping the uniform-random intermediate.
The Fill Option button doesn’t appear after a drag. The button is a small floating UI element that shows up next to the last cell of the drag for a few seconds. If you’ve clicked away or the button is hidden behind another window, you can re-open the same dialog through Edit → Fill → Function… with the filled range still selected.