MathJet is a data analysis environment with a built-in full spreadsheet. The spreadsheet, the plots, and the scripting runtime are not separate programs talking to each other — they are one C++ program. Everything below is what you get when those pieces actually share memory instead of shipping data back and forth.
MathJet is built on a recurring principle: dissolve the boundaries that fragment most data analysis tools.
Technologies are fused. Spreadsheet, scripting runtime, and visualization engine are one C++ program with one memory space — not separate processes communicating through files or kernels.
Views are fused. The same data is simultaneously a spreadsheet, a set of script variables, and the input to plots. Edit any of them and the others reflect it instantly.
Languages are fused. Python, R, .m files,
Excel formulas, and MathJet's own interpreter share one runtime. A
Python object is an R object is a spreadsheet range is a plot input.
Workflows are fused. GUI manipulations and script execution operate on the same shared state, so users can mix interactive exploration and scripted automation freely. Full bidirectional equivalence — every GUI action capturable as script and every script action invokable through the GUI — is being expanded with each release.
Most tools fuse one of these and fragment the rest. MathJet is the only environment that fuses all four — because they were designed together, not assembled from separate parts.
01 · Spreadsheet
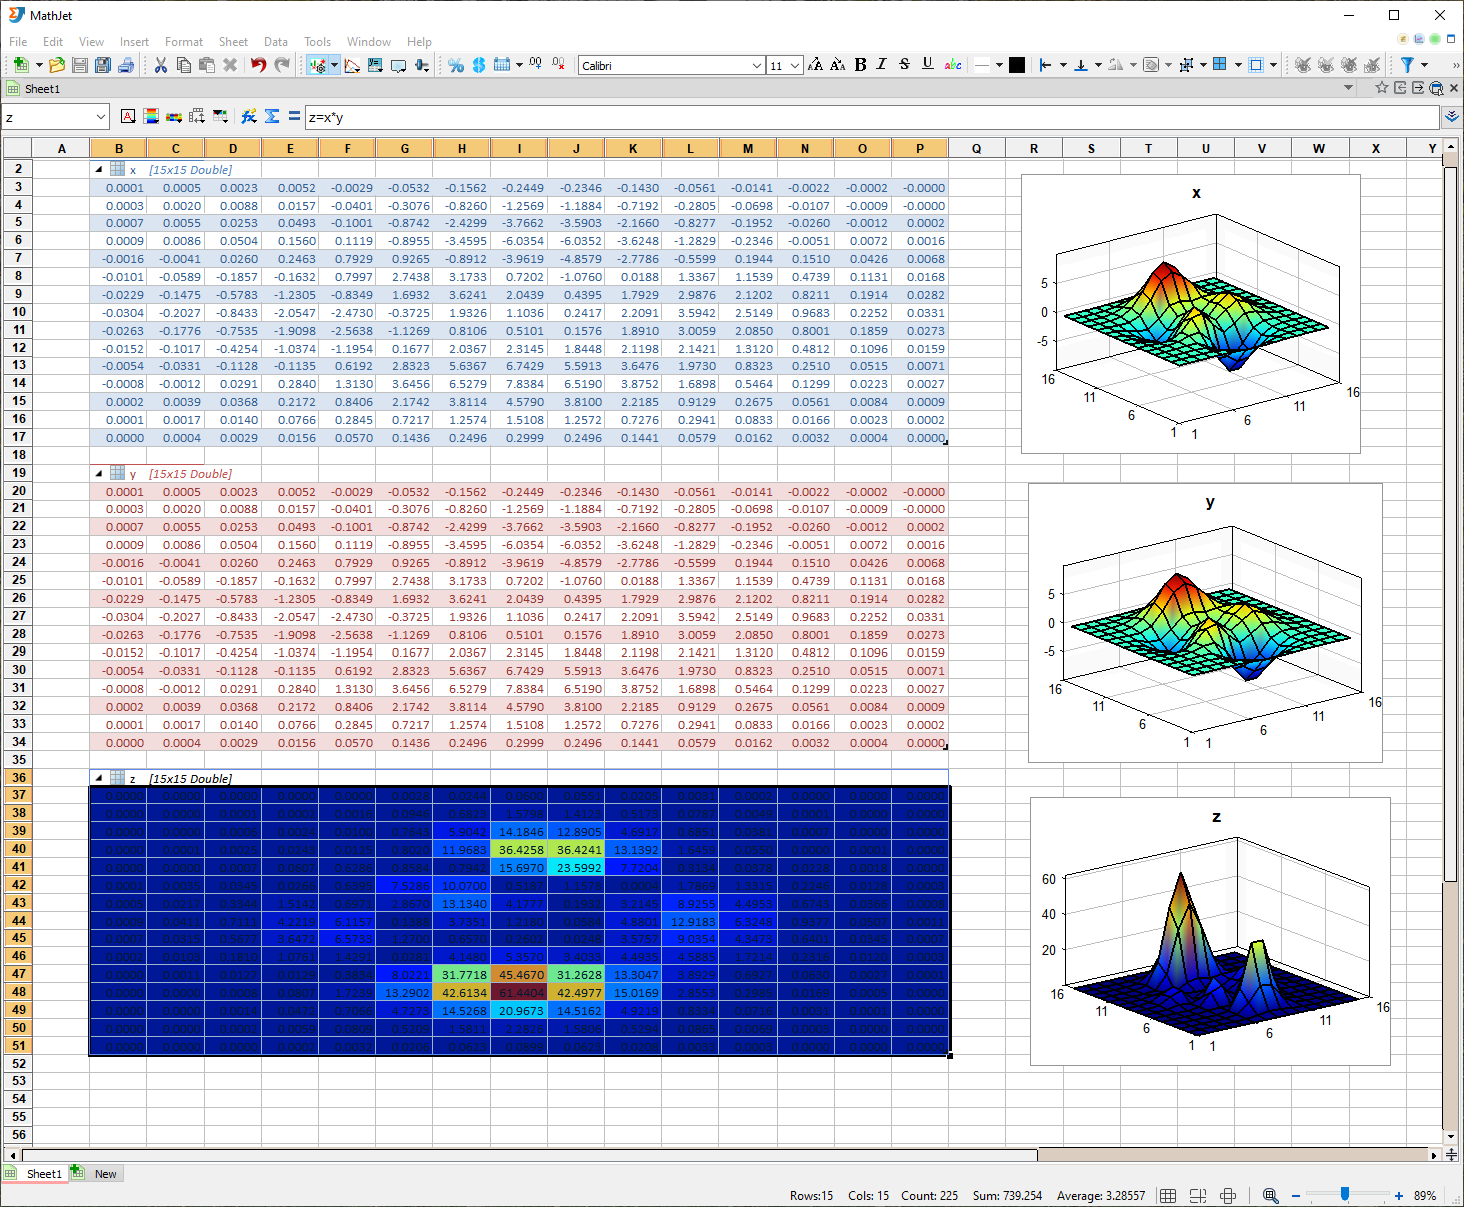
MathJet's spreadsheet is a full Excel-compatible program implementing
nearly all Excel features and loading .xlsx files natively —
formulas, pivot tables, charts, conditional formatting, cell styles,
comments, drawings, and embedded objects. First-class citizen of the
environment, not a data viewer and not an add-on. Round-tripping a file
through MathJet and back out to Excel should give you the same file.
Insert / delete / shift / merge, sort and filter, row and column grouping, frozen rows and columns, autofill by dragging, zoom slider.
Number formats, fonts, borders, alignment, backgrounds, large built-in style gallery, conditional formatting, table styles.
Standard spreadsheet syntax plus direct references to Python, R, and MathJet variables. See § 02 below.
Comments, markers, and shape objects attached to cells — the same shape vocabulary used on charts.
Select a range, create a 2D or 3D plot directly. Click a cell → the corresponding point highlights in the plot, and vice versa.
Promote a block of cells to a first-class variable usable from Python / R / MathJet, or go the other way and expose a multi-dimensional variable as a collapsible table in the sheet.
02 · Polyglot formula bar
The spreadsheet's formula engine and the scripting interpreters are the same code. Which means you can write Python, R, or MATLAB® function calls directly in cell formulas, alongside standard Excel functions. Formulas can also reference variables that scripts created earlier in the same session.
=numpy.mean(A1:A10)
=stats::quantile(A1:A10, 0.95)
=py::numpy.std(A1:A10)
=SUM(A1:A10) + scipy.std(B:B)
First: NumPy's mean on a cell range — Python auto-resolves
from the numpy. prefix. Second: R's quantile
via the stats:: package qualifier — R auto-resolves. Third:
an explicit py:: qualifier for cases where a bare name
could match more than one language. Fourth: an Excel function and a
SciPy function in the same formula.
This is not a UDF bridge and not an Excel add-in. It's the same
interpreter. A formula in a cell evaluates in-process against the same
NumPy array — the same memory — your next script will operate on. And
when the formula's dispatch isn't obvious from prefixes alone,
py:: / r:: / jet:: qualifiers
make the language explicit, the same way C++ or Rust namespace
operators work.
The formula bar is where the fusion architecture becomes concrete. In every other spreadsheet-plus-Python stack, there is a boundary — Excel's formula engine doesn't know Python; Python's runtime doesn't know what a cell is. MathJet has one formula engine. It happens to understand Excel functions, Python, R, and MATLAB because those are the same interpreters.
The same polyglot model scales up to whole script files. A single
.jt file can mix segments in different languages, each
marked with a Jupyter-style cell header:
# %% python
temps = numpy.array(#B2:#B101)
mean_temp = numpy.mean(temps)

# %% r
quartiles <- quantile(temps, c(0.25, 0.5, 0.75))

# %% jet
#D2 = mean_temp
#E2:#G2 = quartiles
User-defined variables (here: temps, mean_temp,
quartiles) flow across the language boundaries automatically
via a shared data frame in process memory. The Python segment writes;
the R segment reads; the Jet segment writes back to the worksheet.
03 · Hybrid language engine
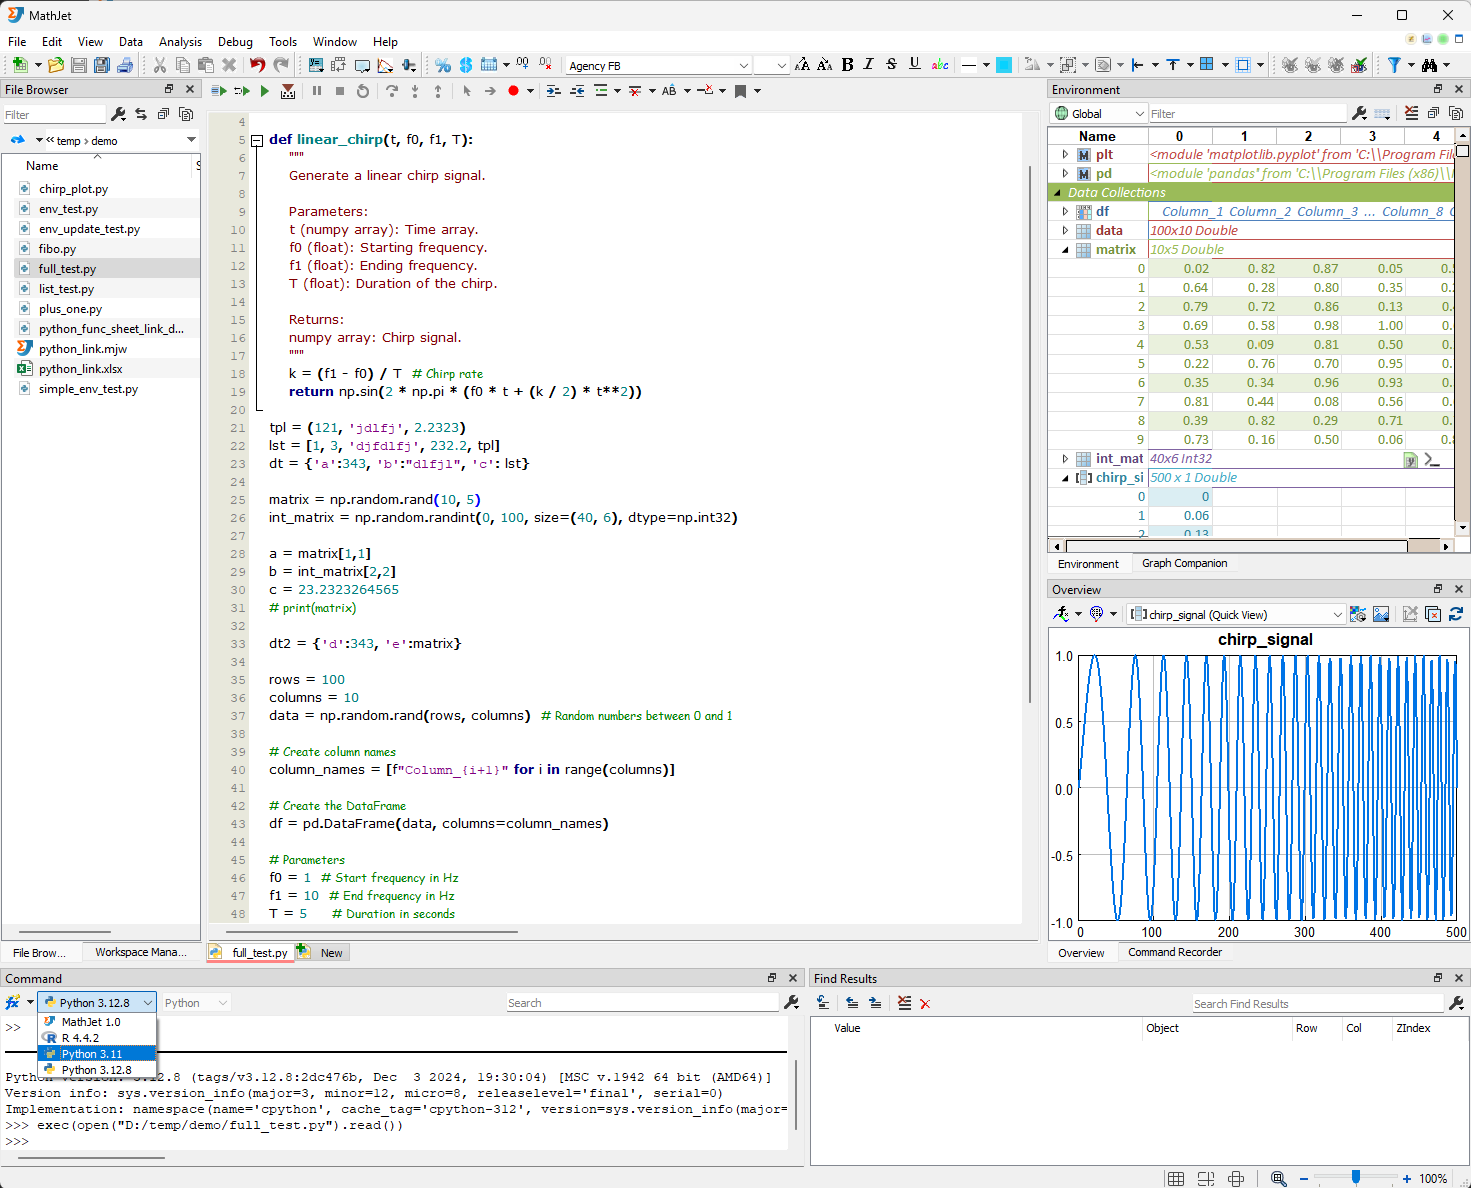
MathJet is written in native C++. Python, R, and MathJet's own interpreter — MATLAB-syntax compatible — all run inside that same C++ process, not as separate kernel processes talking over a protocol. A NumPy array built in Python and an R data frame live in the same memory space. Passing data between languages is an in-process call, not a serialization step.
pickle, no rpy2, no .feather files.
Cross-language data sharing has no middleware.
04 · Visualization engine
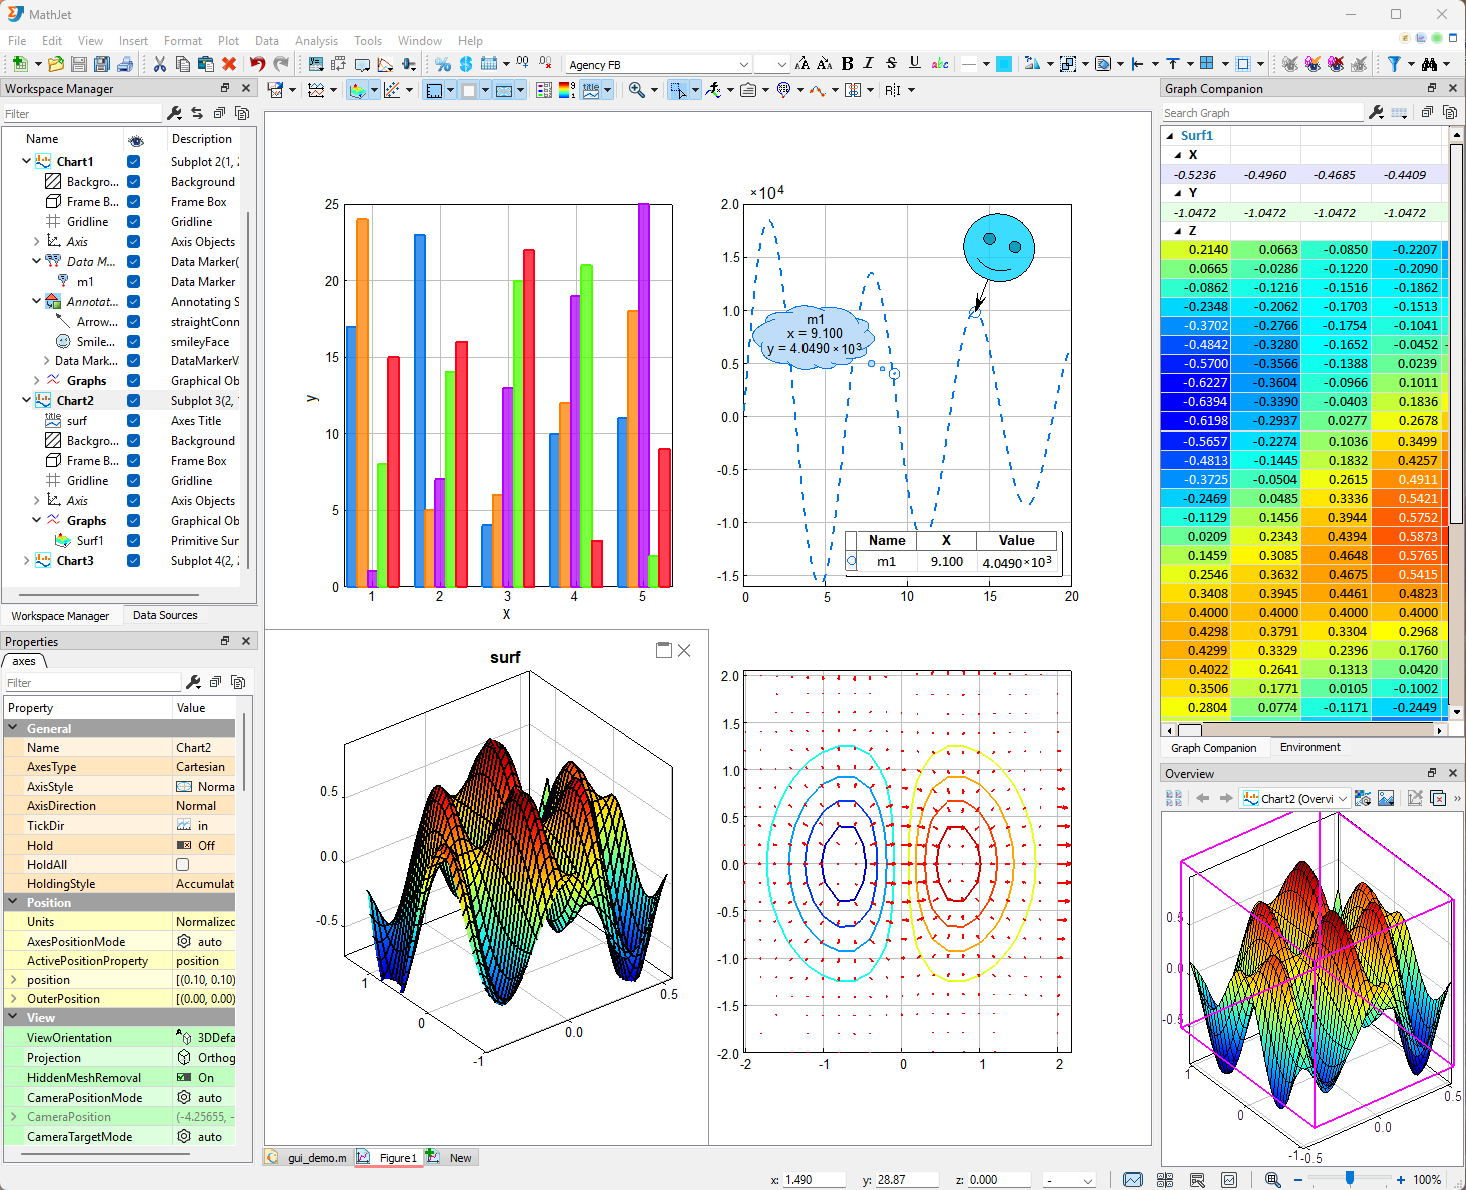
Native C++ rendering, not a web-canvas wrapper. Built as part of MathJet from the ground up, which is why the patented interactive behaviors below exist — they need the spreadsheet and the scripting runtime to respond in real time, and web-based engines can't do that.
From scatter / bubble / line / stem / bar / column / area / fill / pie / radar / polar / compass, to contour / arrow / surface / mesh / waterfall / stream line / ribbon / tube / vector field. 2D and 3D with swappable coordinate systems (Cartesian, polar, radar). Change graph type, coordinate system, axis mode, margin, or color style with one click.
Four probe types — crosshair, ruler, gauge, and magnifier — for reading exact values, distances, and local detail on both 2D and 3D graphs.
Selection tools — axis selection (drag along an axis to select a range), regional selection (draw a region in the plot), alternative selection (invert / combine).
Data labels and markers — per-point data markers, differential markers across two points, axis markers, X / Y markers. All live in summary tables that stay in sync with the chart.
Subplots in an adjustable grid. Drag-and-drop to rearrange, merge cells into larger panes, maximize and restore.
Split axis — turn a single plot with many graphs into sub-axes with independent scales in one click. Dependent graphs — hierarchical drill-down: a single point on a high-level view expands into a child axes showing the underlying subset.
Axis folding — collapse or expand segments of an axis to hide or show data ranges without filtering the underlying data. Reversible data hiding at the visual layer.
Interactive data grouping — group data elements on the chart with a gesture; the groupings propagate to the spreadsheet and the scripting runtime.
Graphical value editing — nudge, replace, draw, repair, smooth, or erase portions of a graph with the mouse. Changes flow back to the underlying data.
Interactive graph filtering — filter visible data through direct manipulation.
Five patents pending cover the capabilities above and other aspects of the system. Specific numbers available on request.
Curve fitting, quick statistics on selected ranges, unit conversion — invoked directly on chart data without leaving the plot.
05 · Notebooks
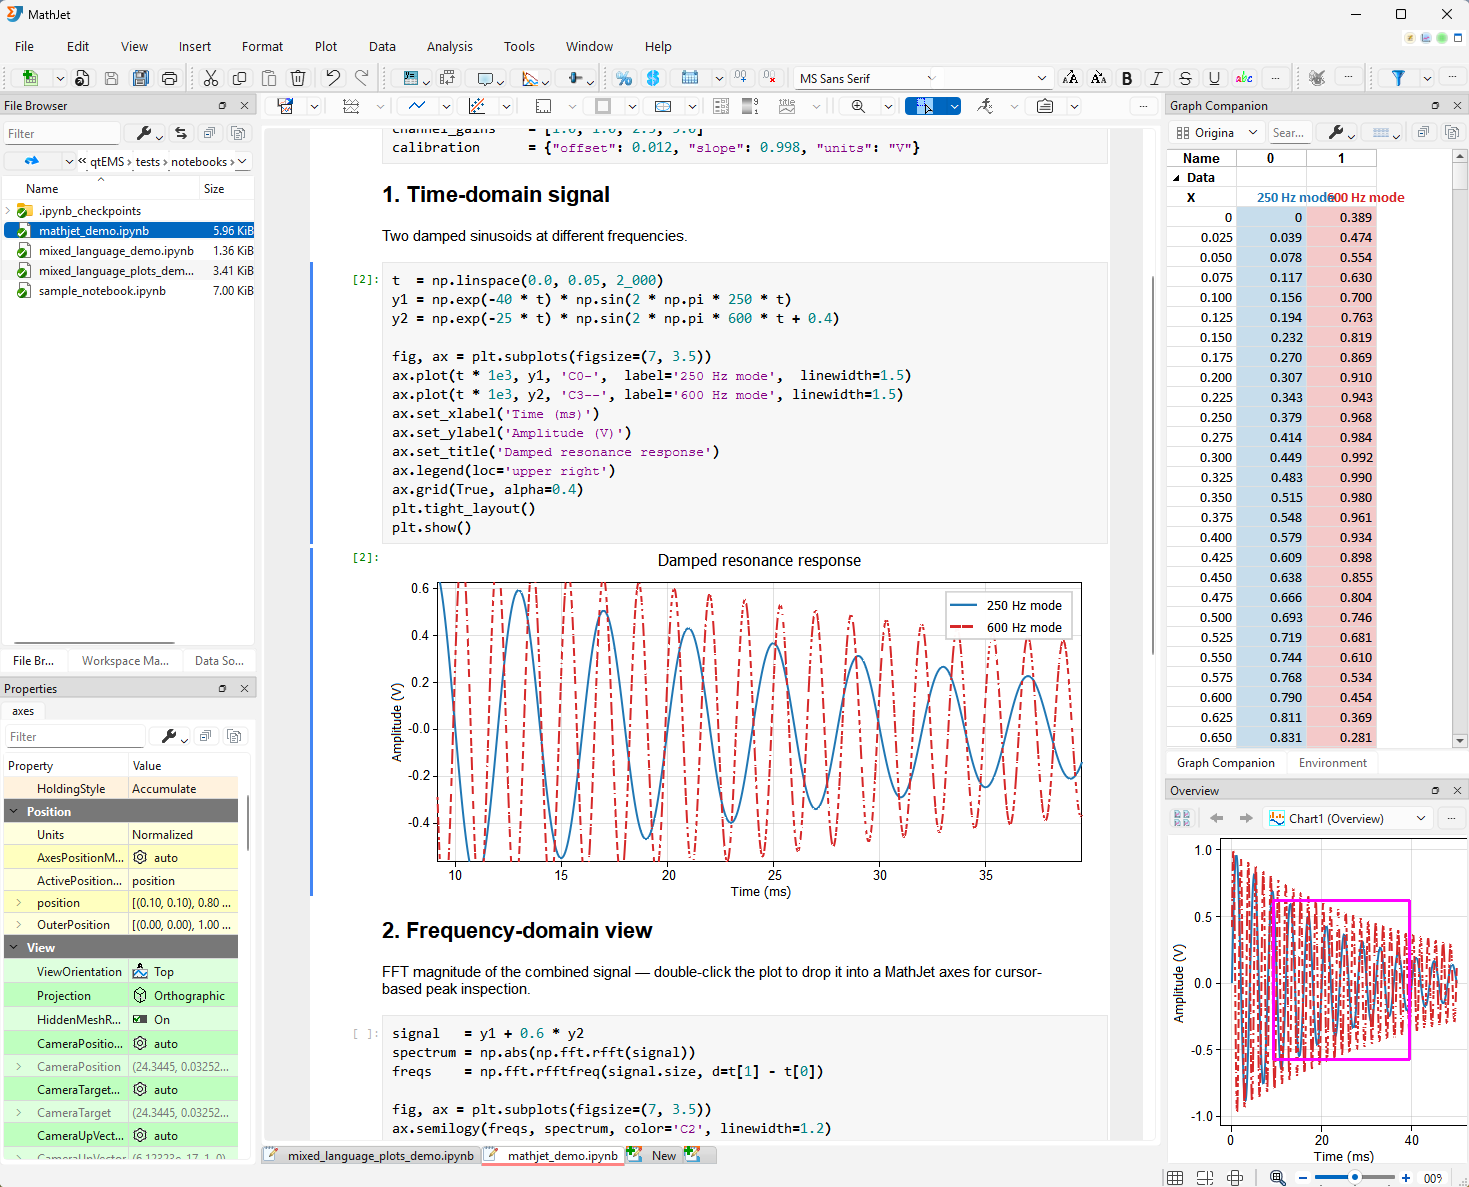
MathJet opens your existing .ipynb files directly. Connect
to a standard Jupyter or IPython kernel and your notebook runs exactly
as it does today.
Or connect to MathJet's own kernel and the same notebook gains live
variable inspection without print(), an editable
spreadsheet view of any DataFrame, and conversion of static
matplotlib plots to native interactive MathJet graphics —
all without changing a line of code.
06 · Cross-cutting
The components above share one state. That makes a specific set of things possible:
If you've worked in Jupyter withipywidgetsorPaneland tried to keep a dashboard synchronized with a notebook's state, you know what this looks like to build. In MathJet it's the default behavior, because there's no gap to bridge.
07 · Workspace
A MathJet session is one file: .mjw. It contains every chart
sheet, spreadsheet, data source, script, style, and bookmark in the
session. The format is built on the Office Open XML container (same
underlying spec as .xlsx and .docx), so opening
an .mjw on another machine gives you the identical
workspace — open figures, open scripts, variable bindings, window layout.
You can also preview .xlsx, .py, .r,
.m, and .txt files in the built-in file browser
by single-clicking.
A pipeline view that makes multi-step analyses reproducible by
construction, and a native MCP interface so an AI assistant can drive
MathJet directly — inspect your spreadsheet, query your plots, modify
variables in place — instead of generating disconnected matplotlib
code that may or may not run on your data.
 MathJet